Debugging Tools in HDevelop
In some cases, it might be necessary to debug a custom tool in order to track a problem that occurs when executing the custom tool. You can debug a custom tool in HDevelop in different ways: via "local" debugging and via "remote" debugging. The local debugging takes place in the regular HDevelop mode that allows you to run stepwise through a program. For the remote debugging, a special debugging mode of HDevelop is used. This special mode allows you to track the execution of the custom tool code in HDevelop while using the tool in MERLIC, i.e., while reproducing the respective problem in MERLIC.
Local Debugging
If you want to check the implemented code of your custom tool, the first step is usually to debug the code locally in HDevelop by creating an HDevelop test program in which the procedure of the custom tool is called. This way, you can run the test program in single steps and also step into the tool procedure to check the execution of the tool procedure code stepwise.
You can open the HDevelop program "Check_Wafer_Test.hdev" to see an example of such a test program. It is provided for the tool template "Check_Wafer" and is located in the directory "\examples\tool_development\tool_templates" within the MERLIC installation.
Required Variables for Local Debugging
To test and debug a custom tool with such an HDevelop test program, a "ToolHandle" is required. It represents the ID of the tool and ensures, among others, that the call of the custom tool procedure can be executed correctly.
For debugging purposes, we also recommend to make use of the global variable "G_DEBUG" that is automatically declared when initializing the "ToolHandle". The global variable enables you to obtain information about procedures that are processed directly by MERLIC and that usually cannot be simulated in HDevelop, e.g., information about the tool state. While stepping trough the HDevelop test program, this global variable provides various useful information such as the name of the procedures that were called and which parameters were used for the respective procedure calls. In the test program for our tool template, the global variable is not used because the main purpose of the program focuses on simply testing the tool functionality instead of the debugging.
Setting Up the HDevelop Test Program for Debugging
You can find detailed information on how to test the functionality of a custom tool in HDevelop in the topic Checking the Tool Procedure in an HDevelop Program. It shows the necessary steps and initializations based on the example tool template "Check_Wafer".
In this section, we want to give a short overview of the adjustments in the HDevelop program that are important for the debugging.
- In the HDevelop program, make sure to initialize and clean up the "ToolHandle" as described in the section Initializing the "ToolHandle" Parameter of the topic Checking the Tool Procedure in an HDevelop Program.
- Add the declaration for the global variable "G_DEBUG" that defines the type of the variable. For debugging, the variable should be defined as a global control variable. It is recommended to add the declaration Copy
global tuple G_DEBUG - If desired, you can set breakpoints on program lines and variables as for the debugging.
After setting up the HDevelop program with the "ToolHandle" and the global variable, you can start to debug the custom tool by running the program step by step and checking the current values and results. As soon as the code of the custom tool procedure has been processed, the global variable provides the information about the procedure calls within the tool procedure.
Remote Debugging
HDevelop supports the debugging of HDevelop code in stand-alone applications. This is referred to as "remote debugging". MERLIC also supports remote debugging in HDevelop. This means that HDevelop may attach to the process of a MERLIC application and once the connection has been established, HDevelop operates in a special debugging mode. This enables you to debug your custom tool "live" in the special debug mode of HDevelop.
In the following, we describe how to enable the remote debugging functionality in MERLIC and how to attach HDevelop to a MERLIC application.
Starting MERLIC for Remote Debugging
To use the remote debugging mode in HDevelop to debug custom MERLIC tools, you first have to ensure that the HDevelop debug server is activated. There are two ways to do so.
Activate the HDevelop Debug Server in MERLIC
The HDevelop debug server can be enabled and disabled in the "Preferences" dialog of the MERLIC Creator.
- Open the MERLIC "Preferences" dialog in the MERLIC Creator using the menu entry "Edit → Preferences".
- Open the tab "Custom Tools".
- In the category "Debugging Options", check the box of the option "Enable HDevelop remote debugging".
- Optionally, change the port in the option "HDevelop debug port". The default port number is 57786. If you define a different port number, make sure to set the same port number in HDevelop when attaching to the MERLIC process. For more information, see the section Attaching HDevelop to a MERLIC Application.
Activate the HDevelop Debug Server in the .ini File
The HDevelop debug server can be enabled and disabled in the .ini file of MERLIC, i.e., by default in the "MERLIC5.ini" file.
- Open the .ini file that is used for MERLIC in any text editor. The default "MERLIC5.ini" file is located in the directory "C:\Users\<username>\AppData\Roaming\MVTec". You can also enter %APPDATA%\MVTec into your file explorer to reach that directory.
- In the [General] section, check the following properties and adjust them if necessary:
- Set the property "HDevelopDebugServer" to "true".
- Set the property "HDevelopDebugPort" to the port you want to use. The default port number is 57786. If you define a different port number, make sure to set the same port number in HDevelop when attaching to the MERLIC process. For more information, see the section Attaching HDevelop to a MERLIC Application.
- Set the property "ToolPath" to the location that contains the custom tool you want to debug in HDevelop. The following example shows a possible setup. However, keep in mind to adjust the tool path to the location of your custom tool.
Copy[General]
HDevelopDebugServer=true
HDevelopDebugPort=57786
ToolPath=C:\Program Files\MVTec\MERLIC-5.7\examples\tool_development\tool_templates - Save your changes.
- Start MERLIC, i.e., the MERLIC Creator. On the startup of MERLIC, the HDevelop debug server will be automatically started and the MERLIC application is ready for the remote debugging in HDevelop.
As soon as you started MERLIC for the remote debugging, you may switch to HDevelop and attach HDevelop to the MERLIC application as described in the next section.
Attaching HDevelop to a MERLIC Application
Before starting HDevelop, make sure to start MERLIC with the required settings for the remote debugging as described in the section above.
- Start HDevelop. Keep in mind that you have to use the HALCON 24.11 Progress-Steady for the current MERLIC version.
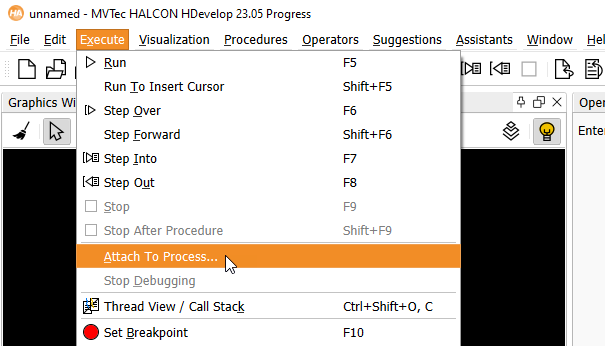
- At the menu bar, open the menu entry "Execute" and select "Attach To Process...". This opens a new dialog with the settings of the debug server.
- Specify the current host name of the MERLIC application. The default host name "localhost" can be used if MERLIC and HDevelop run on the same machine. Your firewall must be configured to allow connections on the specified port. The default port number is 57786. If you define a different port number, make sure to set the same port number in the MERLIC settings as described in the sections above. For more information, see the section Starting MERLIC for Remote Debugging.
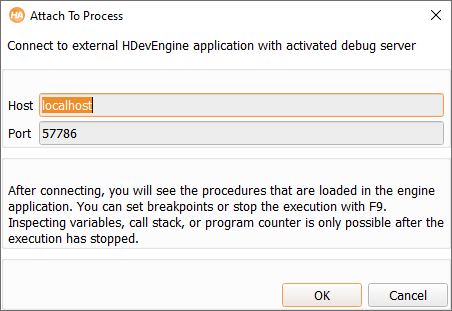
- Click on "OK" to start the connection to the MERLIC application. While connecting to MERLIC, all available MERLIC tools will be loaded in HDevelop. Therefore, it might take some time to establish the connection and start the debug mode.
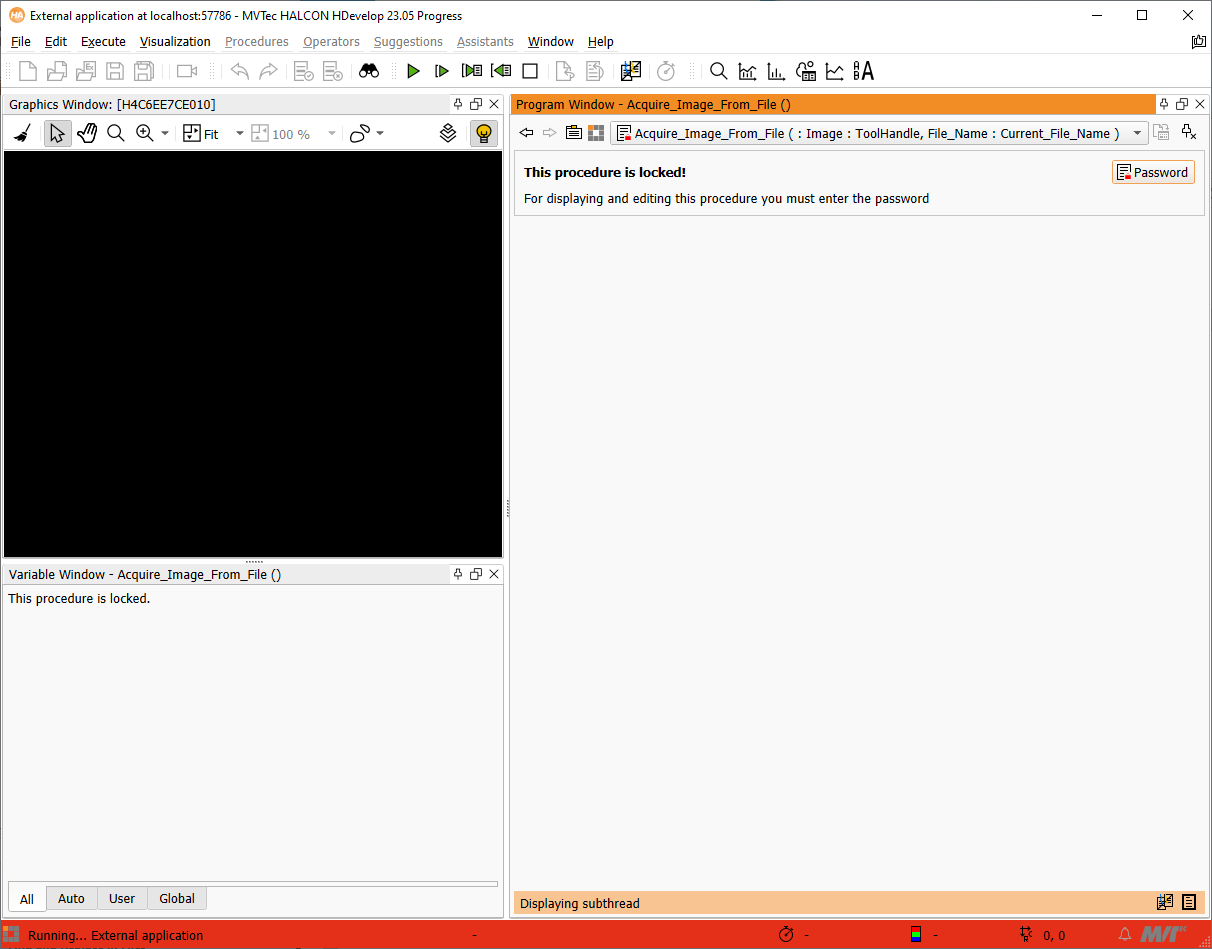
After connecting to MERLIC, large parts of the user interface of HDevelop are grayed out: This applies to the functionality related to the normal operation of HDevelop, such as procedures, operators, assistants, and preferences. The special debug mode is indicated in the window title and by the red background color of the status bar. The background color of the "Program "Window" also changes to indicate the read-only nature of the remote debug mode.
Starting the Remote Debugging of a Custom Tool
Remote debugging is in most parts similar to "local" debugging. The procedure execution is controlled by execution commands, e.g., Stop, Step Over, or Step Into. Debugging is only possible in stopped mode.
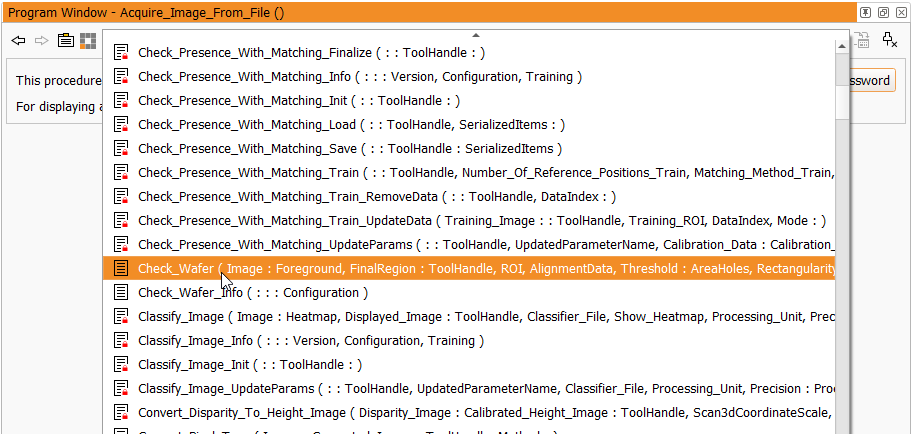
The loaded procedures are available in the drop down menu of the "Program "Window". This includes the procedures of all available standard MERLIC tools and all custom tools that are located in the specified tool path location as well as internal MERLIC procedures and interface procedures that can be used for the tool development. However, internal MERLIC procedures and all procedures of the standard MERLIC tools are protected. Therefore the respective code cannot be viewed in the "Program "Window" when they are selected.
To start debugging a custom tool, you may proceed as follows:
- In HDevelop, select the main procedure of the custom tool you want to debug from the drop down menu of the "Program "Window".
- Set breakpoints on program lines and variables as desired for the debugging. Activated breakpoints persist as long as the external application, i.e., MERLIC, is running. In contrast, deactivated breakpoints disappear on disconnect.
- In MERLIC, use the respective custom tool in the MERLIC Creator, e.g., load an MVApp with the custom tool or add the tool to the Tool Flow of the MERLIC Creator.
- HDevelop will hold the execution at the breakpoint and you may continue to debug the tool in HDevelop as usual.
- If you want to end the debug mode of HDevelop, you can use the menu entry "Execute → Stop Debugging" or simply close HDevelop.
For more information about the remote debugging in HDevelop, see the chapter "9 Remote Debugging" in the HDevelop User's Guide.

