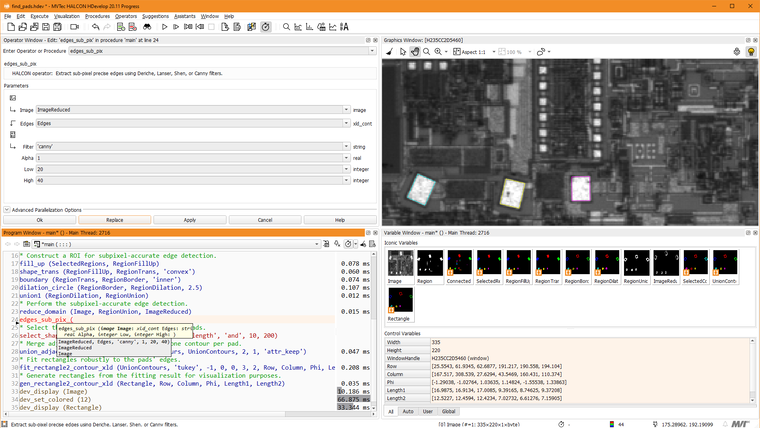
HDevelop - integrated development environment for machine vision

HALCON provides an Integrated Development Environment (IDE) for machine vision: HDevelop is a highly interactive environment that enables you to build image processing solutions fast and efficiently – even while acquiring images from a capture device. As soon as you are satisfied with your machine vision program code, you can integrate it easily into your application using HDevEngine or export it as C++, C, C#, or Visual Basic source code.
The HDevEngine, i.e., the "HDevelop Engine", is a library that acts as an interpreter and lets you directly load and execute HDevelop programs and procedures from within your C++, C#, or Visual Basic application. This allows you to change the vision part of your application without the need of compiling it.
The full functionality of HDevelop (incl. all windows listed above) can be used on all operating systems, which are supported by HALCON (see here). Thanks to the extensive experience HALCON is based on, HDevelop is tailored to the needs of machine vision applications with a GUI that is optimized for usability.

Many assistants to simplify your business
Moreover, HDevelop contains assistants for common subtasks, such as image acquisition, camera calibration, matching, measure or ocr. The graphical user interface of those HDevelop Assistants can be used to interactively set up and configure your solution and insert the corresponding code sequence on demand into your HDevelop program.

The HDevelop GUI is available in various languages
English, German, Spanish, Japanese, French, Portuguese, Chinese (Simplified), Italian, Turkish, Chinese (Traditional), Korean

Create custom tools for MERLIC
HDevelop can also be used to develop custom tools for MERLIC. With these, MERLIC's existing tool library can be extended flexibly to suit any additional needs.

Other helpful windows
HDevelop comes with a lot of helpful tools. To name a few:
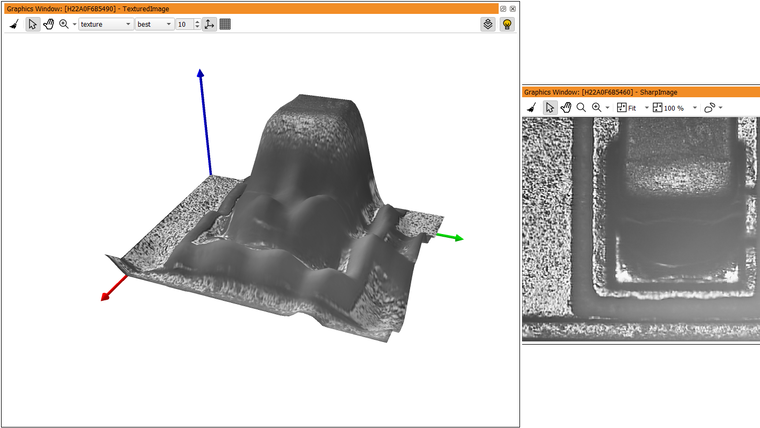
Graphics window

Visualize your data the way you want to see them: Get immediate feedback on the execution of an operator and let HDevelop visualize iconic variables. Display images with an arbitrary number of gray channels and an arbitrary type. Change the way the images are visualized so you can easily interpret your results interactively, and get a feeling for what is important in your data. Change the way an image is displayed by setting look-up-tables, or displaying the gray values as 3D plots or contour lines. Display segmentation results such as regions and subpixel data in a suitable form.
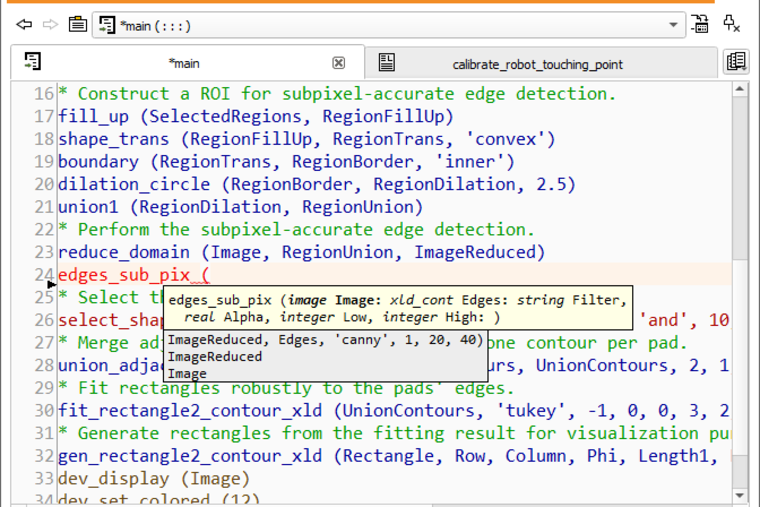
Program window

Debug your application efficiently - Programming becomes very easy: HDevelop offers syntax checks, syntax highlighting, suggested values for parameters of operators, suggested successors and alternative operators, debugging the program, full text editor, integrated online help offering full-text search, and more. Single-step through the program, set breakpoints, and let the program run continuously. Change parameters to obtain the desired result, even while the program is running! The software engineer can develop the application with the help of a full text editor. Editing assistance, the ability to copy and paste lines, as well as advanced autocompletion provide easy-to-use help for programming in the full text editor. The HDevelop profiler tool helps analyzing each operator's execution time.
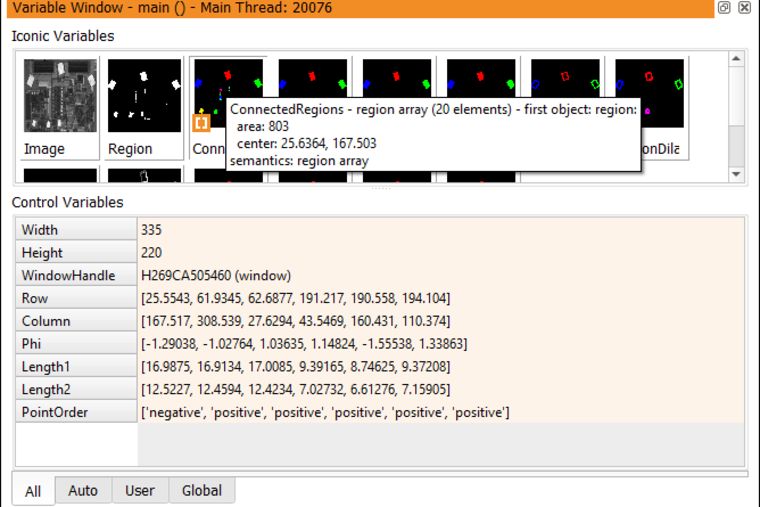
Variable window

See the results of the iconic and numeric variables - Get immediate results of your action. Don't waste time by having to program the visualization of your results! Each selected operator is executed immediately, and the results (iconic and numerical variables) are visualized in the variable and graphics window. Easily inspect the current properties of most important handle variables, simply by double-clicking the handle variable.
