Get Execution Info
Use this tool to get information about the execution, i.e., the acquisition time and duration of the last cycle. You can also use this tool to measure the duration of the execution for a specific tool or a specific set of tools. For more information about the required settings, see the following section.
How to Measure the Execution Time for a Tool
- Add two "Get Execution Info" tools: one above the tool to be measured and one below the tool.
- Connect the "Time" result of the first "Get Execution Info" tool to the "Start Time" parameter of the second "Get Execution Info" tool. This ensures that the time difference is measured from the exact time at which the execution of the tool to be measured is started.
- Set the triggers accordingly:
- Create a trigger from the first "Get Execution Info" tool to the tool to be measured.
- Create a trigger from the tool to be measured to the second "Get Execution Info" tool.
- If a tool is connected to the tool to be measured, create a trigger from the connected tool to the first "Get Execution Info" tool.
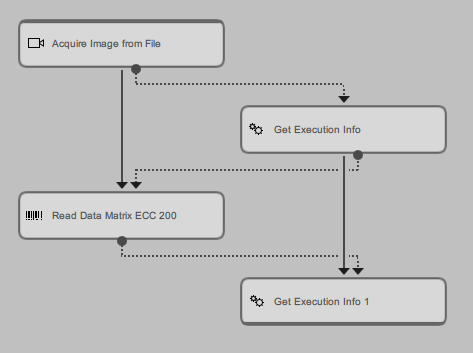
In the example below, you can see the required trigger connections if the execution time of the tool Read Data Matrix ECC 200 is measured. The first trigger connection is created from Acquire Image from File to the first Get Execution Info tool because "Acquire Image from File" is the only tool that sends data to the tool to be measured. The trigger connections from the first "Get Execution Info" tool to "Read Data Matrix ECC 200" and the trigger from "Read Data Matrix ECC 200" to the second "Get Execution Info" ensure that the tools are executed in the right order.
If you want to measure the execution time for a specific set of tools, follow the description above. But instead of only one tool, the selected set of tools is placed between the two "Get Execution Info" tools. If these tools are connected, it is sufficient to create two trigger connections: one from the first "Get Execution Info" tool to the first tool of the tool set and one from the last tool of the tool set to the second "Get Execution Info".
For specific tool constellations and connection settings, the resulting time difference that has been calculated might not be precise. If there are tools in the MERLIC Vision App that can be executed in parallel to the "Get Execution Info" tools or the tool to be measured, the resulting time in the tool result "Duration since Start Time" might also contain the execution time of any tool that has been executed in parallel. In this case the time in "Duration since Start Time" does not represent the execution time on the desired tool.
Therefore, we recommend to adjust the MERLIC Vision App to ensure that the desired tool is executed exclusively at a time.
Execution Behavior
The behavior of this tool regarding the execution differs from the default behavior. Usually a MERLIC tool is executed in the following cases:
- The MERLIC Vision App is explicitly executed in continuous mode.
- The MERLIC Vision App is explicitly executed in "Run Once" mode.
- A MERLIC Vision App with the tool is opened in the MERLIC Creator.
- A parameter value of the tool has been changed in the MERLIC Creator.
However, the tool Get Execution Info is only executed in the following cases:
- The MERLIC Vision App is explicitly executed in continuous mode.
- The MERLIC Vision App is explicitly executed in "Run Once" mode.
This ensures that the tool collects no data when loading an MVApp or changing a parameter value of the tool. The results of the tool, including the counter with the number of execution cycles, returns only data of tool executions that have been triggered explicitly.
Parameters
Basic Parameters
Time Format:
This parameter defines in which "Time Format" the current time is returned in the result "Time". It is set to "simplified" by default. You can change the format at the corresponding connector. Changing the time format will also update the result Time.
|
Value |
Description |
|---|---|
|
simplified |
The returned acquisition time does not include special characters and can therefore be used for file names, e.g., "20200414_094941_108". |
|
ISO-8601 |
The format of the returned acquisition time follows the ISO-8601 standard, e.g., "2020-04-14T09:49:41,108". |
|
relative |
The acquisition time is returned in Unix time stamp format, i.e., the elapsed time since 00:00:00 UTC on January 1, 1970, (Unix epoch). However, instead of seconds, MERLIC returns the time with the number of milliseconds, e.g., "1586850581108.0". |
Start Time:
This parameter represents the start time for the calculation of the time difference that is returned in the result "Duration since Start Time". It is set to 0 by default. The parameter can be used if you want to measure the duration of the execution of a specific tool or a specific set of tools as described in the section How to Measure the Execution Time for a Tool. For this, you have to connect the "Start Time" parameter to the "Time" result of the previous "Get Execution Info" tool to ensure that the time difference is measured from the exact time at which the execution of the tool to be measured is started. When connecting the parameter to the result of a previous tool or defining a value manually, you have to ensure that the time format in the parameter "Start Time" corresponds to the one that is selected in the "Time Format" parameter.
Additional Parameters
Reset:
This parameter enables you to reset the values of selected results that have been processed so far. It is defined as a Boolean value and set to 0 by default. This means that no result is reset. To reset the values, set the parameter to 1. It is automatically set back to 0. The following results will be affected by a reset:
- Counter
- Duration of last Cycle
- Duration since Start Time
- Random Number
If you reset the results, all collected information of the executions will be lost. This cannot be undone. Please make sure to back up the data before resetting the values if required.
Results
Basic Results
Counter:
This result represents the number of executed cycles. The result is returned as an integer number.
Time:
This result returns the current time of the execution. Depending on the selected value in the parameter "Time Format", the time is returned either in "simplified" format, in "ISO-8601", or in "relative" time format.
The following example shows how a specific time is returned for the respective time formats.
Example time:
| 2020 | 04 | 14 | 09 | 49 | 41 | 108 |
|---|---|---|---|---|---|---|
| Year | Month | Day | Hour | Minute | Second | Millisecond |
Resulting time formats:
|
Time Format |
Result |
|---|---|
|
simplified |
20200414_094941_108 |
|
ISO-8601 |
2020-04-14T09:49:41,108 |
|
relative |
1586850581108.0 |
Duration of last Cycle:
This result returns the time difference of the last execution cycle in milliseconds, i.e., the duration between the last and the current execution.
Duration since Start Time:
This result returns the time difference that has been measured from the time defined in the parameter "Start Time" to the current execution time in the result "Time". It is returned in milliseconds. If the parameter "Start Time" is connected to the "Time" result of a previous "Get Execution Info" tool, the resulting time in this result represents the duration of the execution of all tools that are placed between the two "Get Execution Info" tools. In case of long time measurements, i.e., > 24 hours, we recommend to use the time format "relative".
Tool State:
"Tool State" returns information about the state of the tool and thus can be used for error handling. For more information, see Tool State Result
Additional Results
Random Number:
This result produces a random real number between 0 and 1 for test purposes.
Processing Time:
This result returns the duration of the most recent execution of the tool in milliseconds. The result is provided as additional result. Therefore, it is hidden by default but it can be displayed via the ![]() button beside the tool results. For more information see the section Processing Time in the tool reference overview.
button beside the tool results. For more information see the section Processing Time in the tool reference overview.

