Groups
It is possible to group multiple tools in the Tool Flow panel in order to provide a clear overview in your MERLIC Vision App (MVApp). In the following, you can find general information on the visualization of groups in the Tool Flow panel and the Tool Workspace of the MERLIC Creator. For more information on how to create and work with groups in MERLIC, see Creating and Configuring Groups.
Groups are visualized in the Tool Flow panel with a graphical representation of stacked tools including the icon  . A group is always displayed the same in the Tool Flow panel no matter how many tools are included.
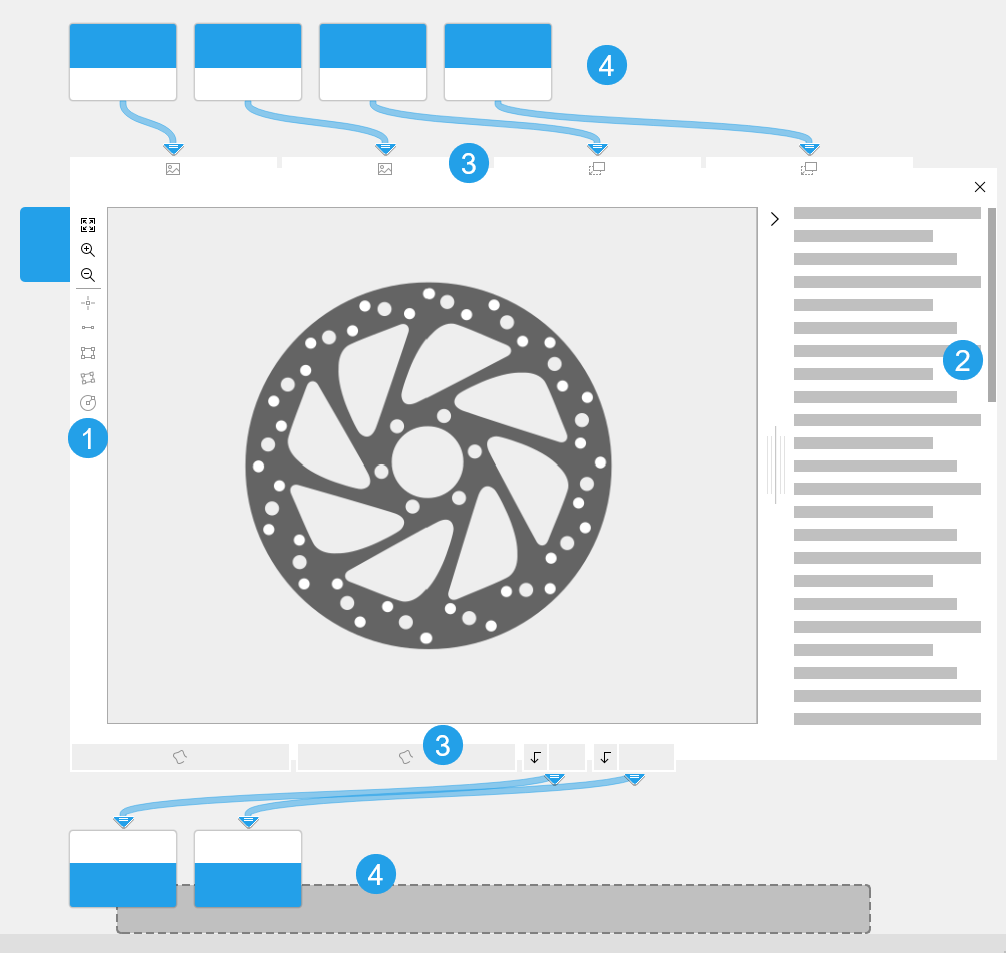
In the Tool Workspace of the MERLIC Creator, a group is visualized similar to a regular tool with a Tool Board. It shows connections to previous and subsequent tools, a graphic window if available, as well as a Quick Info. However, there are still some differences to regular tools, e.g., regarding which parameters and results are available at the group in the Tool Workspace.
 Toolbar
The ROI toolbar with the buttons to draw regions of interest (ROIs) into the image is also provided for a group. Active buttons ![]() are displayed darker than disabled buttons
are displayed darker than disabled buttons ![]() . Whether an ROI button is active and thus available for use depends on the tools in the group and the Frontend design of the MVApp. If a tool in the group provides an ROI parameter which is connected in the Frontend design, the respective ROI button is also active and available for use in the group.
. Whether an ROI button is active and thus available for use depends on the tools in the group and the Frontend design of the MVApp. If a tool in the group provides an ROI parameter which is connected in the Frontend design, the respective ROI button is also active and available for use in the group.
 Quick Info
Similar to the Tool Board of a regular MERLIC tool, you can find a short documentation about groups on the right. It provides a general description which type of connections, parameters, and results can be shown, and how to work with a group. You can expand and collapse the Quick Info by clicking on the respective arrow icon on the top right of the graphics window.
 Connectors
Connectors that are displayed at a group represent connectors of the tools in the group, i.e., tool parameters and tool results. However, a group only shows specific parameters and results of the tools:
- Parameters and results that are connected to previous tools or subsequent tools outside of the group.
- Parameters and results that have been added as MVApp parameters and MVApp results before the group was created.
- Parameters and results that are connected in the Frontend design of the MVApp.
The connectors that represent iconic parameters are displayed in a specific order from left to right: images, regions, contours, ROIs, calibration data, alignment data. The iconic parameter at the top left is the one displayed in the graphic window of the group.
For more general information on the different types of connectors, see Connectors.
 Connections
A group shows only the connections of the displayed connectors, i.e., the connections to parameters and results that meet the conditions listed above in the section Connectors. Connections to previous tools are located at the top and the connections to subsequent tools are located at the bottom. However, a connection arrow only indicates that there is at least one connection to a tool within the group. Internally, there might be incoming connections from a previous tool to multiple tools within the group or outgoing connections from multiple tools within the group to one and the same subsequent tool. If you want to see all connections in detail, you have to ungroup the tools.
For more information about connections, see the topic Connections.

