Evaluate Regions
Use this tool to evaluate regions based on a specific feature.
This tool requires that the regions are available and delivered from a previous tool. Therefore, the parameter "Regions" must be connected with an appropriate result of a previous tool.
Therefore, you first have to extract the regions to be evaluated in a previous tool and then connect the resulting regions to this tool.
For this tool easyTouch and easyTouch+ are available. This means you may filter the measured regions using "Minimum Feature Value" and "Maximum Feature Value" while all regions are measured and the corresponding parameters are adapted automatically.
To start the evaluation select the feature you want to evaluate. The regions that already fit to the currently defined parameter setting are highlighted in the color defined for 'accepted', green by default. To select a different region, move the mouse over the desired region to be evaluated. MERLIC will highlight the regions with similar properties that will be included in the evaluation in the defined easyTouch color, e.g., blue by default. The regions that will not be included in the evaluation are highlighted by the defined color for 'rejected', e.g., red by default. If you want to evaluate the previewed regions, click on the region to confirm the selection. The parameters of the feature are automatically adjusted to fit the selected regions. However, they still can be adjusted manually at the corresponding connectors.
Alternatively you may evaluate regions based on fixed feature values. If the parameter values are set manually, all regions that fit to the parameter setting will be highlighted in the defined color for 'ok', e.g., green by default.
Parameters
Basic Parameters
Image:
Use this parameter to set an image as background. This should usually be the image, the processed features e.g., contours or ROIs are based on. If no image is connected, the background will be black.
If a color image is used as input image for this tool, only the first channel, i.e., the red channel, is used for the processing.
This applies only to values of the parameters "Feature Name" and "Feature Values" that concern gray values, e.g., "minimum gray value".
Regions:
This parameter represents the regions to be evaluated. The regions must be delivered from a previous tool. Therefore, you have to connect the parameter with the respective result of a previous tool. The connected region is then used for the evaluation. The margin of the regions is highlighted in the defined color for 'region input', e.g., red by default. This makes it easier to recognize the regions to be evaluated.
Feature Name:
This parameter defines the name of the feature that is evaluated for the regions. It is set to "area" by default. This means that the area of the selected regions is evaluated, e.g., if it is within the allowed area range. You may choose a different feature to be evaluated at the corresponding connector.
|
Value |
Description |
Value range |
Unit |
|---|---|---|---|
|
number |
The number of the regions is used for the evaluation. |
0 ... 10 000 000 |
- |
|
index |
The zero-based index within the input array of the regions is used for the evaluation. This value can be used to check whether all regions with the requested indices are available. |
0 ... 10 000 000 |
- |
|
area |
The regions are evaluated with respect to their area. |
0 ... 10 000 000 |
pixel |
|
anisometry |
The anisometry of the regions is used for the evaluation, i.e., the relation between main radius and secondary radius of an ellipse that has the same aspect ratio as the region. |
1 ... 10 000 000 |
- |
|
circularity |
The regions are evaluated based on their similarity to a circle. |
0 .. 1 |
- |
|
convexity |
The regions are evaluated based on their convexity. |
0 .. 1 |
- |
|
compactness |
The regions are evaluated based on their compactness, i.e., the course of its contours and holes. If the region is long and has holes, its compactness is higher than 1. |
1 ... 10 000 000 |
- |
|
rectangularity |
The regions are evaluated based on their similarity to a rectangle. |
0 .. 1 |
- |
|
x center |
The regions are evaluated based on the coordinates of their column centers. |
0 ... 10 000 000 |
pixel |
|
y center |
The regions are evaluated based on the coordinates of their row center. |
0 ... 10 000 000 |
pixel |
|
width |
The regions are evaluated based on the widths of their enclosing rectangles parallel to the coordinate axes. |
0 ... 10 000 000 |
pixel |
|
height |
The regions are evaluated based on the heights of their enclosing rectangles parallel to the coordinate axes. |
0 ... 10 000 000 |
pixel |
|
inner width |
The regions are evaluated based on the widths of the largest axis-parallel rectangle that fits into the regions. |
0 ... 10 000 000 |
pixel |
|
inner height |
The regions are evaluated based on the heights of the largest axis-parallel rectangle that fits into the regions. |
0 ... 10 000 000 |
pixel |
|
inner radius |
The regions are evaluated based on the radius of the largest inner circle that fits into the regions. |
0 ... 10 000 000 |
pixel |
|
outer radius |
The regions are evaluated based on the radius of the smallest circle that surrounds the regions. |
0 ... 10 000 000 |
pixel |
|
x start |
The regions are evaluated based on the column coordinate of the upper left corner of their enclosing rectangle parallel to the coordinate axes. |
0 ... 10 000 000 |
pixel |
|
y start |
The regions are evaluated based on the row coordinate of the upper left corner of their enclosing rectangle parallel to the coordinate axes. |
0 ... 10 000 000 |
pixel |
|
x end |
The regions are evaluated based on the column coordinate of the lower right corner of their enclosing rectangle parallel to the coordinate axes. |
0 ... 10 000 000 |
pixel |
|
y end |
The regions are evaluated based on the row coordinate of the lower right corner of their enclosing rectangle parallel to the coordinate axes. |
0 ... 10 000 000 |
pixel |
|
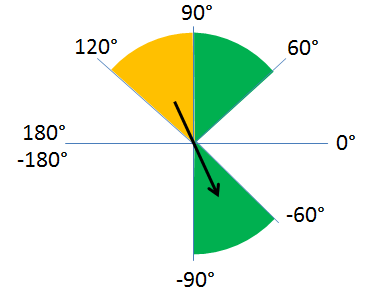
orientation |
The regions are evaluated based on their orientation. The determined orientation that is returned in the result "Feature Values" is given in a range between −90° and 90° since the regions can also be selected by their corresponding angle in the opposite quadrant. E.g., if "Minimum Feature Value" is set to 60° and "Maximum Feature Value" is set to 120°, all regions with an orientation between 60° to 90° and −90° to −60° are classified as accepted. This is the case because for the range from 90 to 120 the corresponding angles in the opposite quadrant range from −90 to −60.
|
−180 ... 180 |
degrees |
|
area_of_holes |
The regions are evaluated based on the area of the holes in the regions. |
0 ... 10 000 000 |
pixel |
|
number of holes |
The regions are evaluated based on the number of holes in the regions. |
0 ... 10 000 000 |
- |
|
maximum diameter |
The regions are evaluated based on the maximal distance between two boundary points of a region. |
0 ... 10 000 000 |
pixel |
|
major length |
The regions are evaluated based on the first half length of the enclosing rectangle of each region. |
0 ... 10 000 000 |
pixel |
|
minor length |
The regions are evaluated based on the second half length of the enclosing rectangle of each region. |
0 ... 10 000 000 |
pixel |
|
minimum gray value |
The regions are evaluated based on their minimum gray values. |
gray values |
|
|
maximum gray value |
The regions are evaluated based on their maximum gray values. |
gray values |
|
|
average gray value |
The regions are evaluated based on the mean gray values of the regions. |
gray values |
|
|
median gray value |
The regions are evaluated based on the median of the gray values. |
gray values |
|
|
gray value deviation |
The regions are evaluated based on the deviation of the gray values. |
gray values |
Minimum Feature Value:
This parameter defines the minimum value of the evaluated feature. It is set to 150 by default. It is adjusted automatically when the regions to be evaluated are selected manually. You can also use this feature value as reference for the evaluation. Set the desired value at the connector and all regions that fit to the current parameter setting will be highlighted in green. You can set the value in the range from 0 to 10 000 000 but only as high as the "Maximum Feature Value". However, the actual value range depends on the pixel type of the image and the currently selected feature, e.g., if "orientation" is selected for "Feature Name", the value can only be set between −180 and 180. Please see the table in the description of the parameter "Feature Name" for the available value range of each feature.
Maximum Feature Value:
This parameter defines the maximum value of the evaluated feature. It is set to 100 000 by default. It is adjusted automatically when the regions to be evaluated are selected manually. You can also use this feature value as reference for the evaluation. Set the desired value at the connector and all regions that fit to the current parameter setting will be highlighted in green. You can set the value at a range from 0 to 10 000 000 but only as low as the "Minimum Feature Value". However, the actual value range depends on the pixel type of the image and the currently selected feature, e.g., if "orientation" is selected for "Feature Name", the value can only be set between −180 and 180. Please see the table in the description of the parameter "Feature Name" for the available value range of each feature.
Additional Parameters
Feature Value Tolerance:
This parameter defines a tolerance value for the defined feature in "Feature Name". This parameter is only relevant if easyTouch is used to determine feature values. Otherwise it does not influence the evaluation of the regions. Therefore, depending on the selected name at the parameter "Feature Name", the connector "Feature Value Tolerance" is grayed out. This means that it is not relevant for use as long as you are working with the current selected name.
The parameter is processed in different ways depending on the feature that is selected in "Feature Name". For some features it is used to define a percentage value by how much the actual feature values of the regions may exceed the values that are set in "Minimum Feature Value" and "Maximum Feature Value". For some other features it is used to define an absolute value by how much the actual feature values may exceed the minimum and maximum values. There are also some features, i.e., "number", and "index", for which the "Feature Value Tolerance" is not taken into account. The table below shows which features are affected and whether the percentage value is used or the absolute value.
The "Feature Value Tolerance" is set to 20 by default. If you use easyTouch to determine the maximum and minimum feature values of the selected region, MERLIC will include all regions in the evaluation whose feature values lie in the defined tolerance value, e.g., if the feature "width" is selected in "Feature Name" and the "Feature Value Tolerance" is set to 10, all regions with a width up to 10% larger or smaller than the selected contour are included in the evaluation. You have to change its value manually at the connector if necessary. You can set the value to a range from 0 to 100.
|
Value |
Affected? |
Percentage value |
Absolute value |
|---|---|---|---|
|
number |
|
|
|
|
index |
|
|
|
|
area |
✔ |
✔ |
|
|
anisometry |
✔ |
✔ |
|
|
circularity |
✔ |
✔ |
|
|
convexity |
✔ |
✔ |
|
|
compactness |
✔ |
✔ |
|
|
rectangularity |
✔ |
✔ |
|
|
x center |
✔ |
|
✔ |
|
y center |
✔ |
|
✔ |
|
width |
✔ |
✔ |
|
|
height |
✔ |
✔ |
|
|
inner width |
✔ |
✔ |
|
|
inner height |
✔ |
✔ |
|
|
inner radius |
✔ |
✔ |
|
|
outer radius |
✔ |
✔ |
|
|
x start |
✔ |
|
✔ |
|
y start |
✔ |
|
✔ |
|
x end |
✔ |
|
✔ |
|
y end |
✔ |
|
✔ |
|
orientation |
✔ |
|
✔ |
|
area_of_holes |
✔ |
✔ |
|
|
number of holes |
✔ |
|
✔ |
|
maximum diameter |
✔ |
✔ |
|
|
major length |
✔ |
✔ |
|
|
minor length |
✔ |
✔ |
|
|
minimum gray value |
✔ |
|
✔ |
|
maximum gray value |
✔ |
|
✔ |
|
average gray value |
✔ |
|
✔ |
|
median gray value |
✔ |
|
✔ |
|
gray value deviation |
✔ |
|
✔ |
Results
Basic Results
Accepted Regions:
This result returns the accepted regions. They are visualized in the defined color setting for 'ok', e.g., green by default. A region is accepted if the value of the evaluated feature fits within the defined value range.
Rejected Regions:
This result returns the rejected regions. They are visualized in the defined color setting for 'rejected', e.g., red by default. A region is rejected if the value of the evaluated feature does not fit within the defined value range and therefore lies outside of the allowed range.
Feature Values:
This result returns the actual feature values of the evaluated regions. They are returned in a tuple as a real number.
All Regions Accepted:
This result returns a boolean value that indicates if all regions have been accepted. If the feature values of all evaluated regions lie within the allowed value range, the value 1 is returned. If the feature value of at least one region does not fit to the value range, the boolean value 0 is returned. If "index" is selected as feature for the evaluation, this result is an indicator whether all regions with the respective indices defined in "Minimum Feature Value" and "Maximum Feature Value" are available in the image.
Tool State:
"Tool State" returns information about the state of the tool and thus can be used for error handling. For more information, see Tool State Result
Additional Results
Number of Accepted Regions:
This result returns the number of accepted regions, i.e., the number of regions whose feature value fit to the allowed feature value range.
Number of Rejected Regions:
This result returns the number of rejected regions, i.e., the number of regions whose feature value does not fit to the allowed feature value range.
Processing Time:
This result returns the duration of the most recent execution of the tool in milliseconds. The result is provided as additional result. Therefore, it is hidden by default but it can be displayed via the ![]() button beside the tool results. For more information see the section Processing Time in the tool reference overview.
button beside the tool results. For more information see the section Processing Time in the tool reference overview.
Application Examples
This tool is used in the following MERLIC Vision App examples:
- check_correct_filling_on_3d_height_images.mvapp
- classify_and_inspect_wood.mvapp
- count_defect_clusters.mvapp
- segment_pill_defects.mvapp
- segment_pills_by_shape.mvapp

