 Function Plot
This widget allows you to visualize parameter values of your MERLIC Vision App in the Frontend. Furthermore, you can set specific plot properties, such as lower and upper bounds. Currently, it is only supported to plot parameter values on the y-axis.

A typical use case is to monitor the size of drill holes.
Creating the Application in the MERLIC Creator
- Open a new MERLIC Vision App.
- Insert the tool Determine Alignment with Matching to determine the alignment data by using easyTouch in the training window.
- Insert the tool Measure Circle and select a circle inside the image.
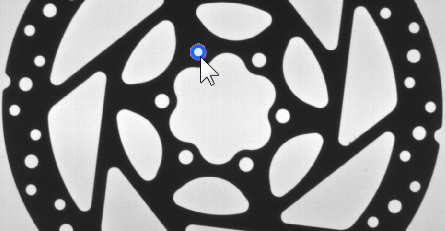
- Add the parameter "Alignment Data" and connect it from the "Alignment Data" of the tool Determine Alignment with Matching.
- Insert the tool Determine Data History and connect the "Radius" to the parameter "Data Value".
Creating the Frontend Design with the Function Plot
- Open the Designer and add the widget "Function Plot" to your workspace.
- Adjust the function plot properties:
- Click at the property name "Parameters" to open the parameter selection dialog.
- Select the parameter "Determine Data History → Buffer Data" from the list of available parameters.
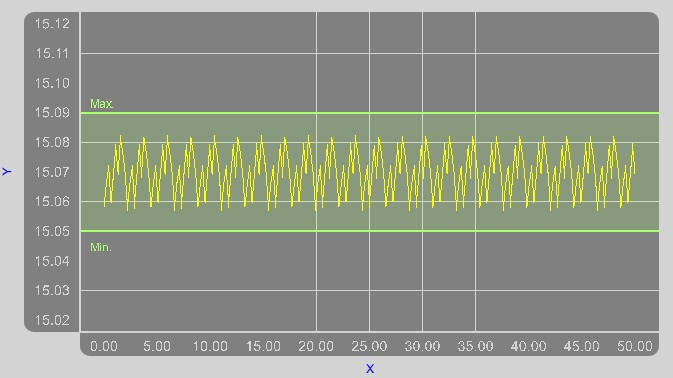
- Set further plotting properties, e.g., "Lower Bound" to "15.05" and "Upper Bound" to "15.09".
- Confirm the changes and close the parameter selection dialog.
- Adjust the "Minimum Y-Range" to "15.02" and the "Maximum Y-Range" to "15.12".
- Optionally adjust further style properties, e.g., "Font Size" or "X-Axis Tick Step Size".
Check the Plotted Values in the Frontend
Launch the Frontend and execute the MERLIC Vision App continuously. The circle radii are plotted continuously while the application is running.
Style
X, Y:
Adjust the position of the widget by typing the desired coordinate values of the upper left corner into the input field.
Z-Order:
Adjust the z-order of the widget by typing the desired value into the input field. This defines which widget is displayed on top if several widgets are positioned at the same place, for example, if widget "A" has "Z-Order" "0" and widget "B" has "Z-Order" "1", widget "B" will be displayed on top of widget "A".
Width:
Adjust the width of the widget. The width is defined in pixels and set to 500 by default. To change the value, type the new width into the input field. It must be at least 280 and not be bigger than 2147483647.
Height:
Adjust the height of the widget. The height is defined in pixels and set to 250 by default. To change the value, type the new height into the input field. It must be at least 180 and not be bigger than 2147483647.
Background Color:
Adjust the background color of the widget. To change the color, click into the color field and select a new color in the color selection dialog or enter the color code manually.
Grid Color:
Adjust the grid color of the function plot. To change the color, click into the color field and select a new color in the color selection dialog or enter the color code manually.
Font Color:
Adjust the color of the labels and the title of the function plot. To change the color, click into the color field and select a new color in the color selection dialog or enter the color code manually.
Title:
Define the title of the function plot by typing the text directly into the text field.
Title Font Size:
Adjust the size of the title. Adjust the size of the displayed font. Select the font size from the combo box or type the value directly into the input field.
Font Family:
Select the font family of the displayed text in the drop-down menu of this property.
X-Axis Label:
Define the label for the x-axis by typing the text directly into the text field.
Y-Axis Label:
Define the label for the y-axis by typing the text directly into the text field.
Label Font Size:
Adjust the size of the labels for the x-axis and y-axis. Adjust the size of the displayed font. Select the font size from the combo box or type the value directly into the input field.
Label Font Family:
Select the font family of the labels for the x-axis and y-axis in the drop-down menu of this property.
Show Vertical Tick Lines:
Activate or deactivate the visualization of vertical tick lines. By default they are activated and for each tick mark on the x-axis a tick line is displayed in the function plot. To deactivate its visualization, select "false" from the drop-down menu.
X-Axis Tick Labels:
Define the value range for the tick labels of the x-axis by typing the desired value range directly into the input field in the following form: "n..m". "n" is the start value and "m" is the end value of the tick labels. It is set to a value range of "0..1000" by default. The values of the tick marks are displayed stepwise according to the value defined in the property "X-Axis Tick Step Size".
X-Axis Tick Step Size:
Adjust the step size of the tick marks at the x-axis by typing the desired step size directly into the input field. It is set to 100.00 by default. The step size defines which values of the specified value range are displayed at the x-axis. If the property "X-Axis Tick Labels" is set to a range of "0..10" and the step size in the property "X-Axis Tick Step Size" is set to 2, the function plot graph displays the following tick mark labels at the x-axis: 0, 2, 4, 6, 8, 10.
Values Font Size:
Adjust the size of the x- and y-axis values. Adjust the size of the displayed font. Select the font size from the combo box or type the value directly into the input field.
Values Font Family:
Select the font family of the x- and y-axis values in the drop-down menu of this property.
Values Font Color:
Adjust the color of the x- and y-axis values. To change the color, click into the color field and select a new color in the color selection dialog or enter the color code manually.
Minimum Y-Range:
Set the minimum value for the y-axis of the function plot by typing the desired value into the input field.
Maximum Y-Range:
Set the maximum value for the y-axis of the function plot by typing the desired value into the input field.
Data
If you create a tool group in your MVApp, make sure to connect your tool parameters and results in the Frontend Designer before grouping. For more information, see Connecting to Tools in a Group in Adjusting Your Widgets.
Parameters:
Select the parameters to be plotted. Click on the "Edit..." button of the property to open the selection dialog and add the data you want to plot via the arrow buttons. You may choose from all suitable tool parameters and results of your MERLIC Vision App. You can also adjust the drawing order by changing the order of the selected data.
On the right of the selection dialog you can configure the settings of each selected parameter. The section "Plotting Properties" contains more information about the settings which can be adjusted for the parameters.
The following properties are available for each parameter that has been selected in the property "Parameters".
Color:
Adjust the color of the plotted values. To change the color, click into the color field and select a new color in the color selection dialog or enter the color code manually.
Pen Width:
Adjust the width of plotted function by typing the desired value directly into the input field. It is set to 1.00 by default.
Data Values visible:
Activate or deactivate the visualization of the y-values in the function plot. By default the y-values are not visible. To activate the visualization, select "true" in the drop-down menu.
Display Bounds:
Activate or deactivate the visualization of the bounds that are defined in the properties "Upper Bound" and "Lower Bound". By default the bounds are visible. This enables you to visualize a predefined value range, e.g., a tolerance range, in the function plot. To deactivate the visualization of the bounds, select "false" in the drop-down menu.
Bounds Color:
Adjust the color of the bounds. To change the color, click into the color field and select a new color in the color selection dialog or enter the color code manually.
Lower Bound:
Adjust the value for the lower bound by typing the desired value directly into the input field. It is set to 8.00 by default.
Lower Bound Label:
Define the label for the lower bound by typing the text directly into the text field.
Upper Bound:
Adjust the value for the upper bound by typing the desired value directly into the input field. It is set to 21.00 by default.
Upper Bound Label:
Define the label for the upper bound by typing the text directly into the text field.
Application Example
This widget is used in the following MERLIC Vision App examples:
- demonstrate_evaluate_expression.mvapp

