Step-by-step tutorial, HALCON
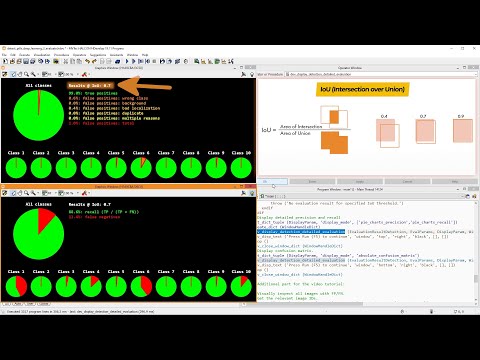
First, we will take a look at how you can influence the inference results by filtering them according to their overlaps and assigned confidence values. Then, we will inspect some pie charts, visualizing the precision and recall of the model on a given dataset. Additionally, a confusion matrix helps us analyze the classes in detail. Lastly, we show how to visualize images with false positives and false negatives.
Please note: Once you watch the video, data will be transmitted to Youtube/Google. For more information, see Google Privacy.
Activate VideoWatch out other videos about HALCON's Deep-Learning-Based Object Detection: